Previsão do preço do ouro para 2025, 2026 - 2030: Previsão para 5, 10 e 20 anos
Previsão do preço do ouro Os preços do ouro são influenciados por várias questões económicas e geopolíticas, incluindo a inflação, as política...
26.03.2025 16:38
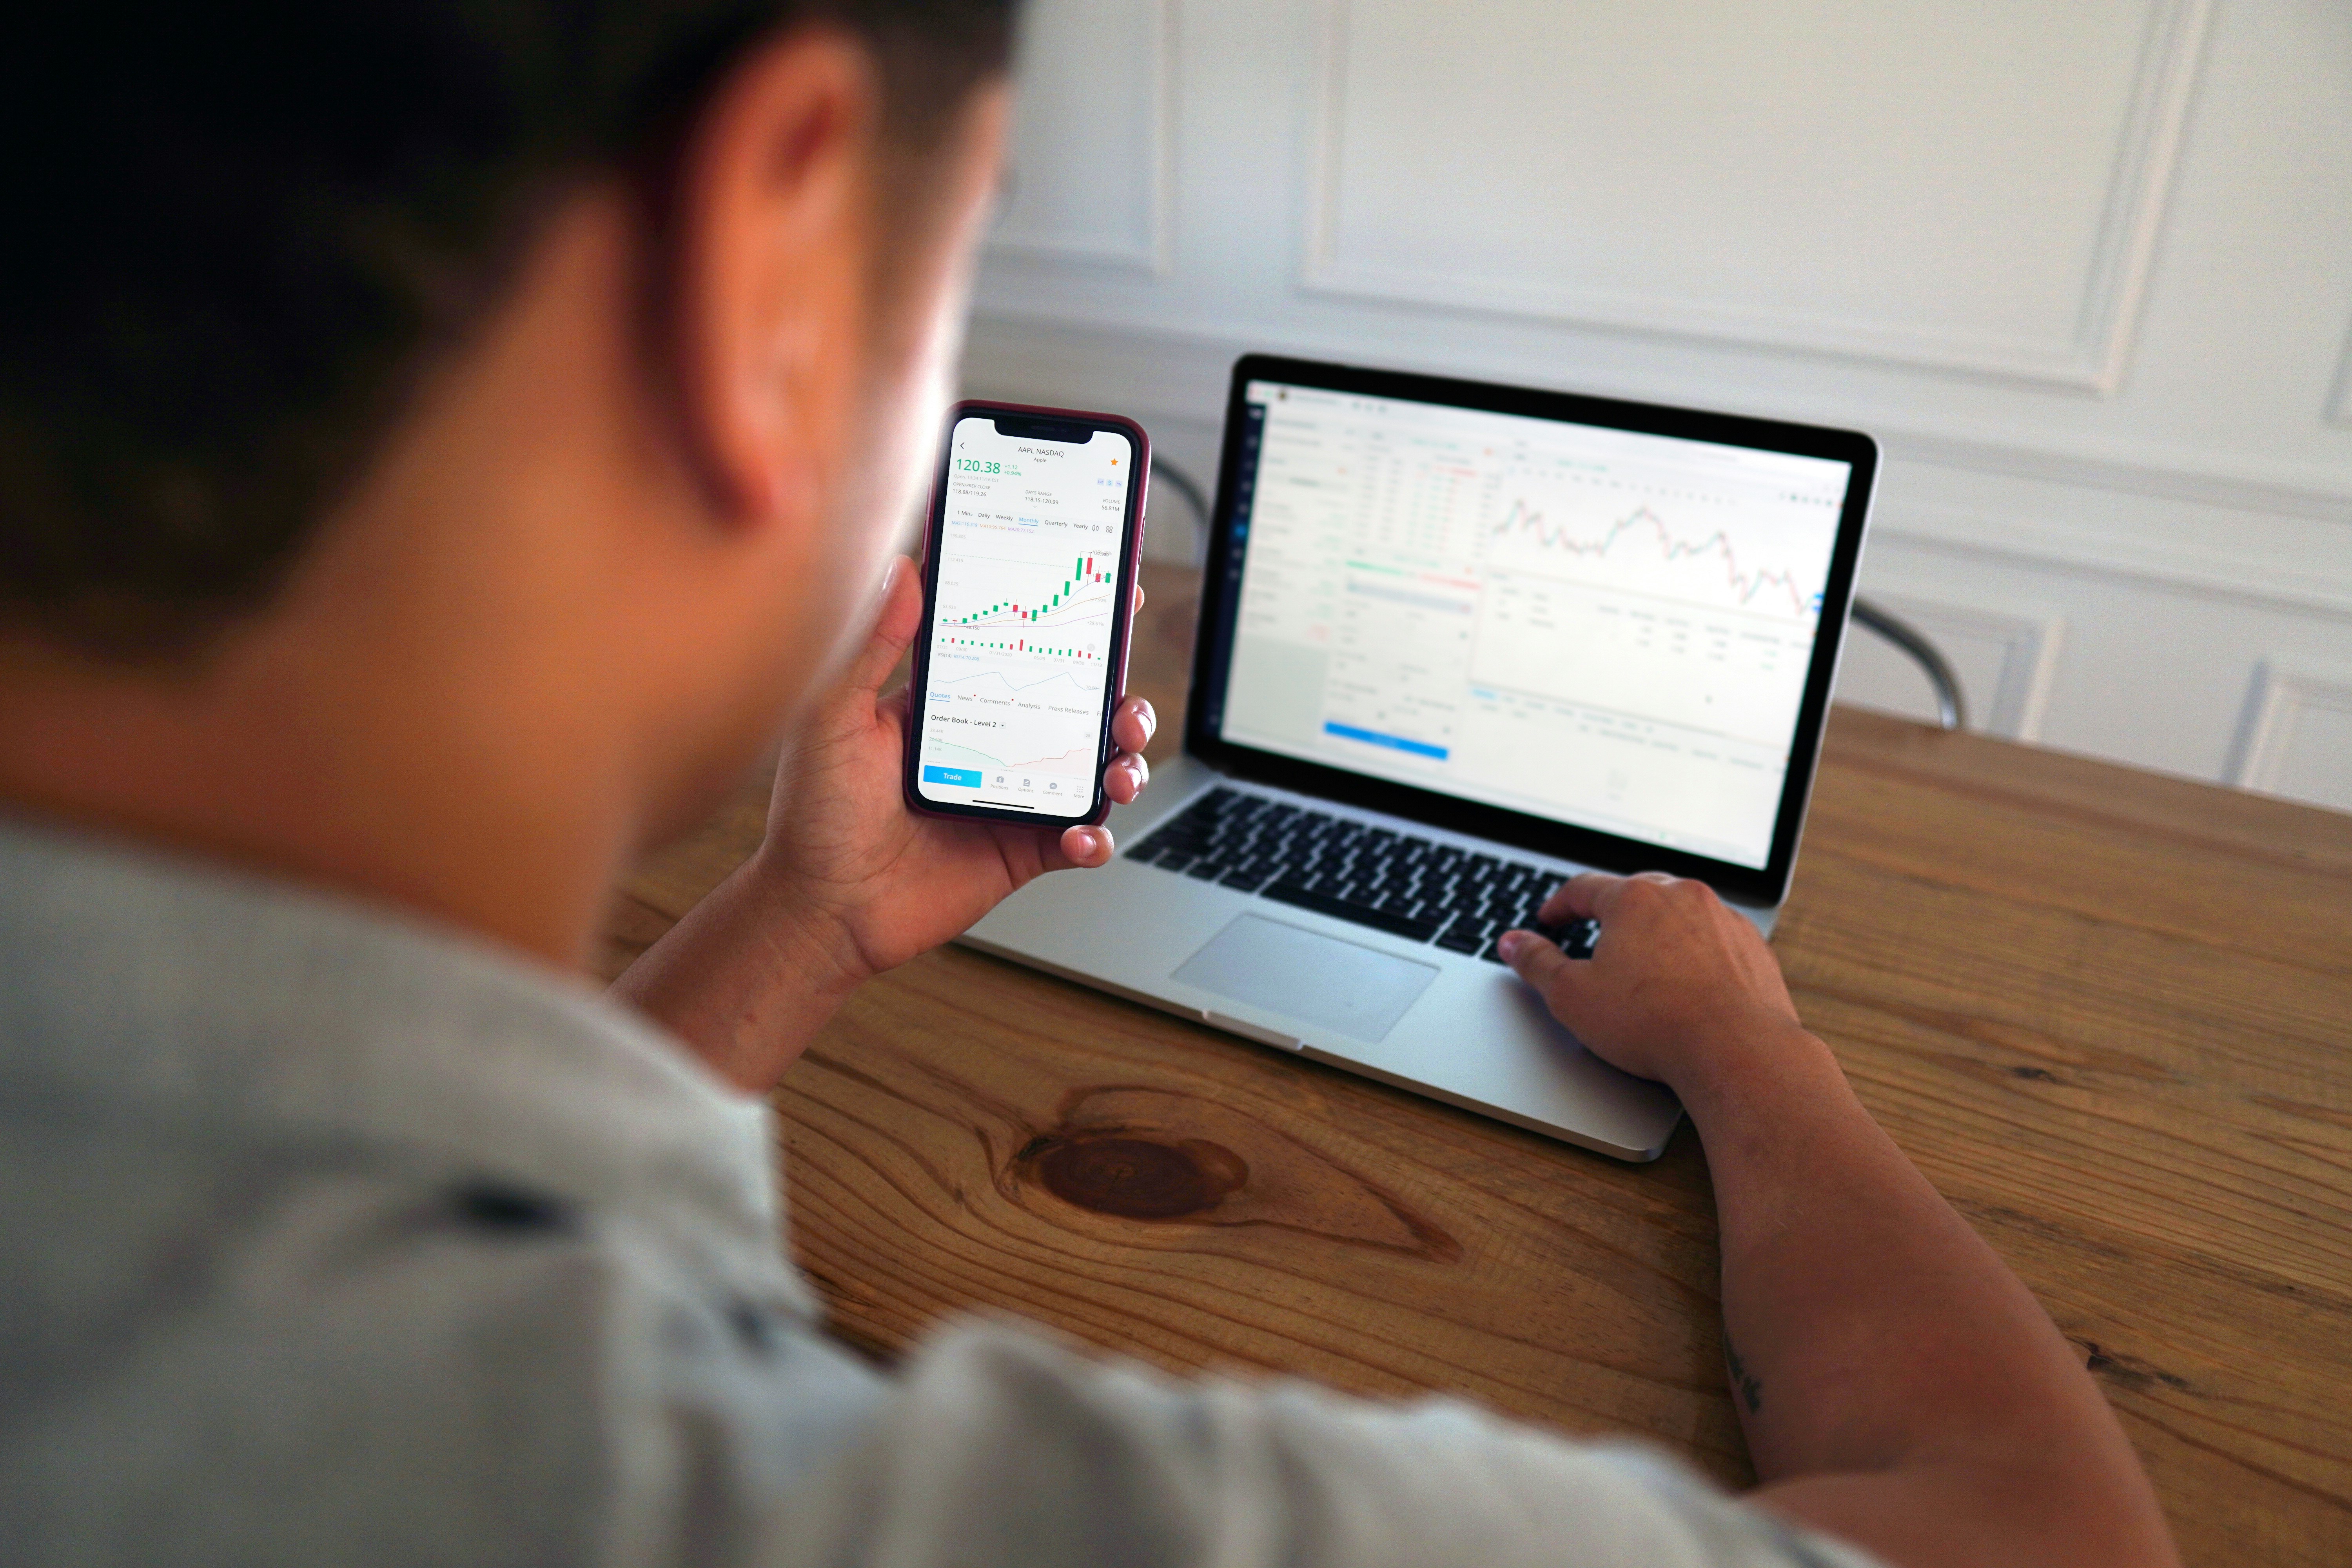
O que é negociação e como funciona? Guia para iniciantes
O que é a negociação e como funciona? Guia para principiantes O mundo dos instrumentos financeiros evoluiu para um mundo fascinante, no qual e...
16.01.2025 01:35
Indústria de bens de consumo de movimento rápido (FMCG): o que é, tipos e lucratividade
Indústria de bens de grande consumo (FMCG) A indústria de bens de consumo rápido é uma componente crítica e de elevada procura da economia glo...
11.12.2024 04:36

O que é uma Análise PEST? Benefícios e Casos de Uso Empresarial
O que é uma análise PEST? A análise PEST é uma ferramenta estratégica que ajuda a compreender os factores externos que determinam as oportunid...
10.12.2024 05:03
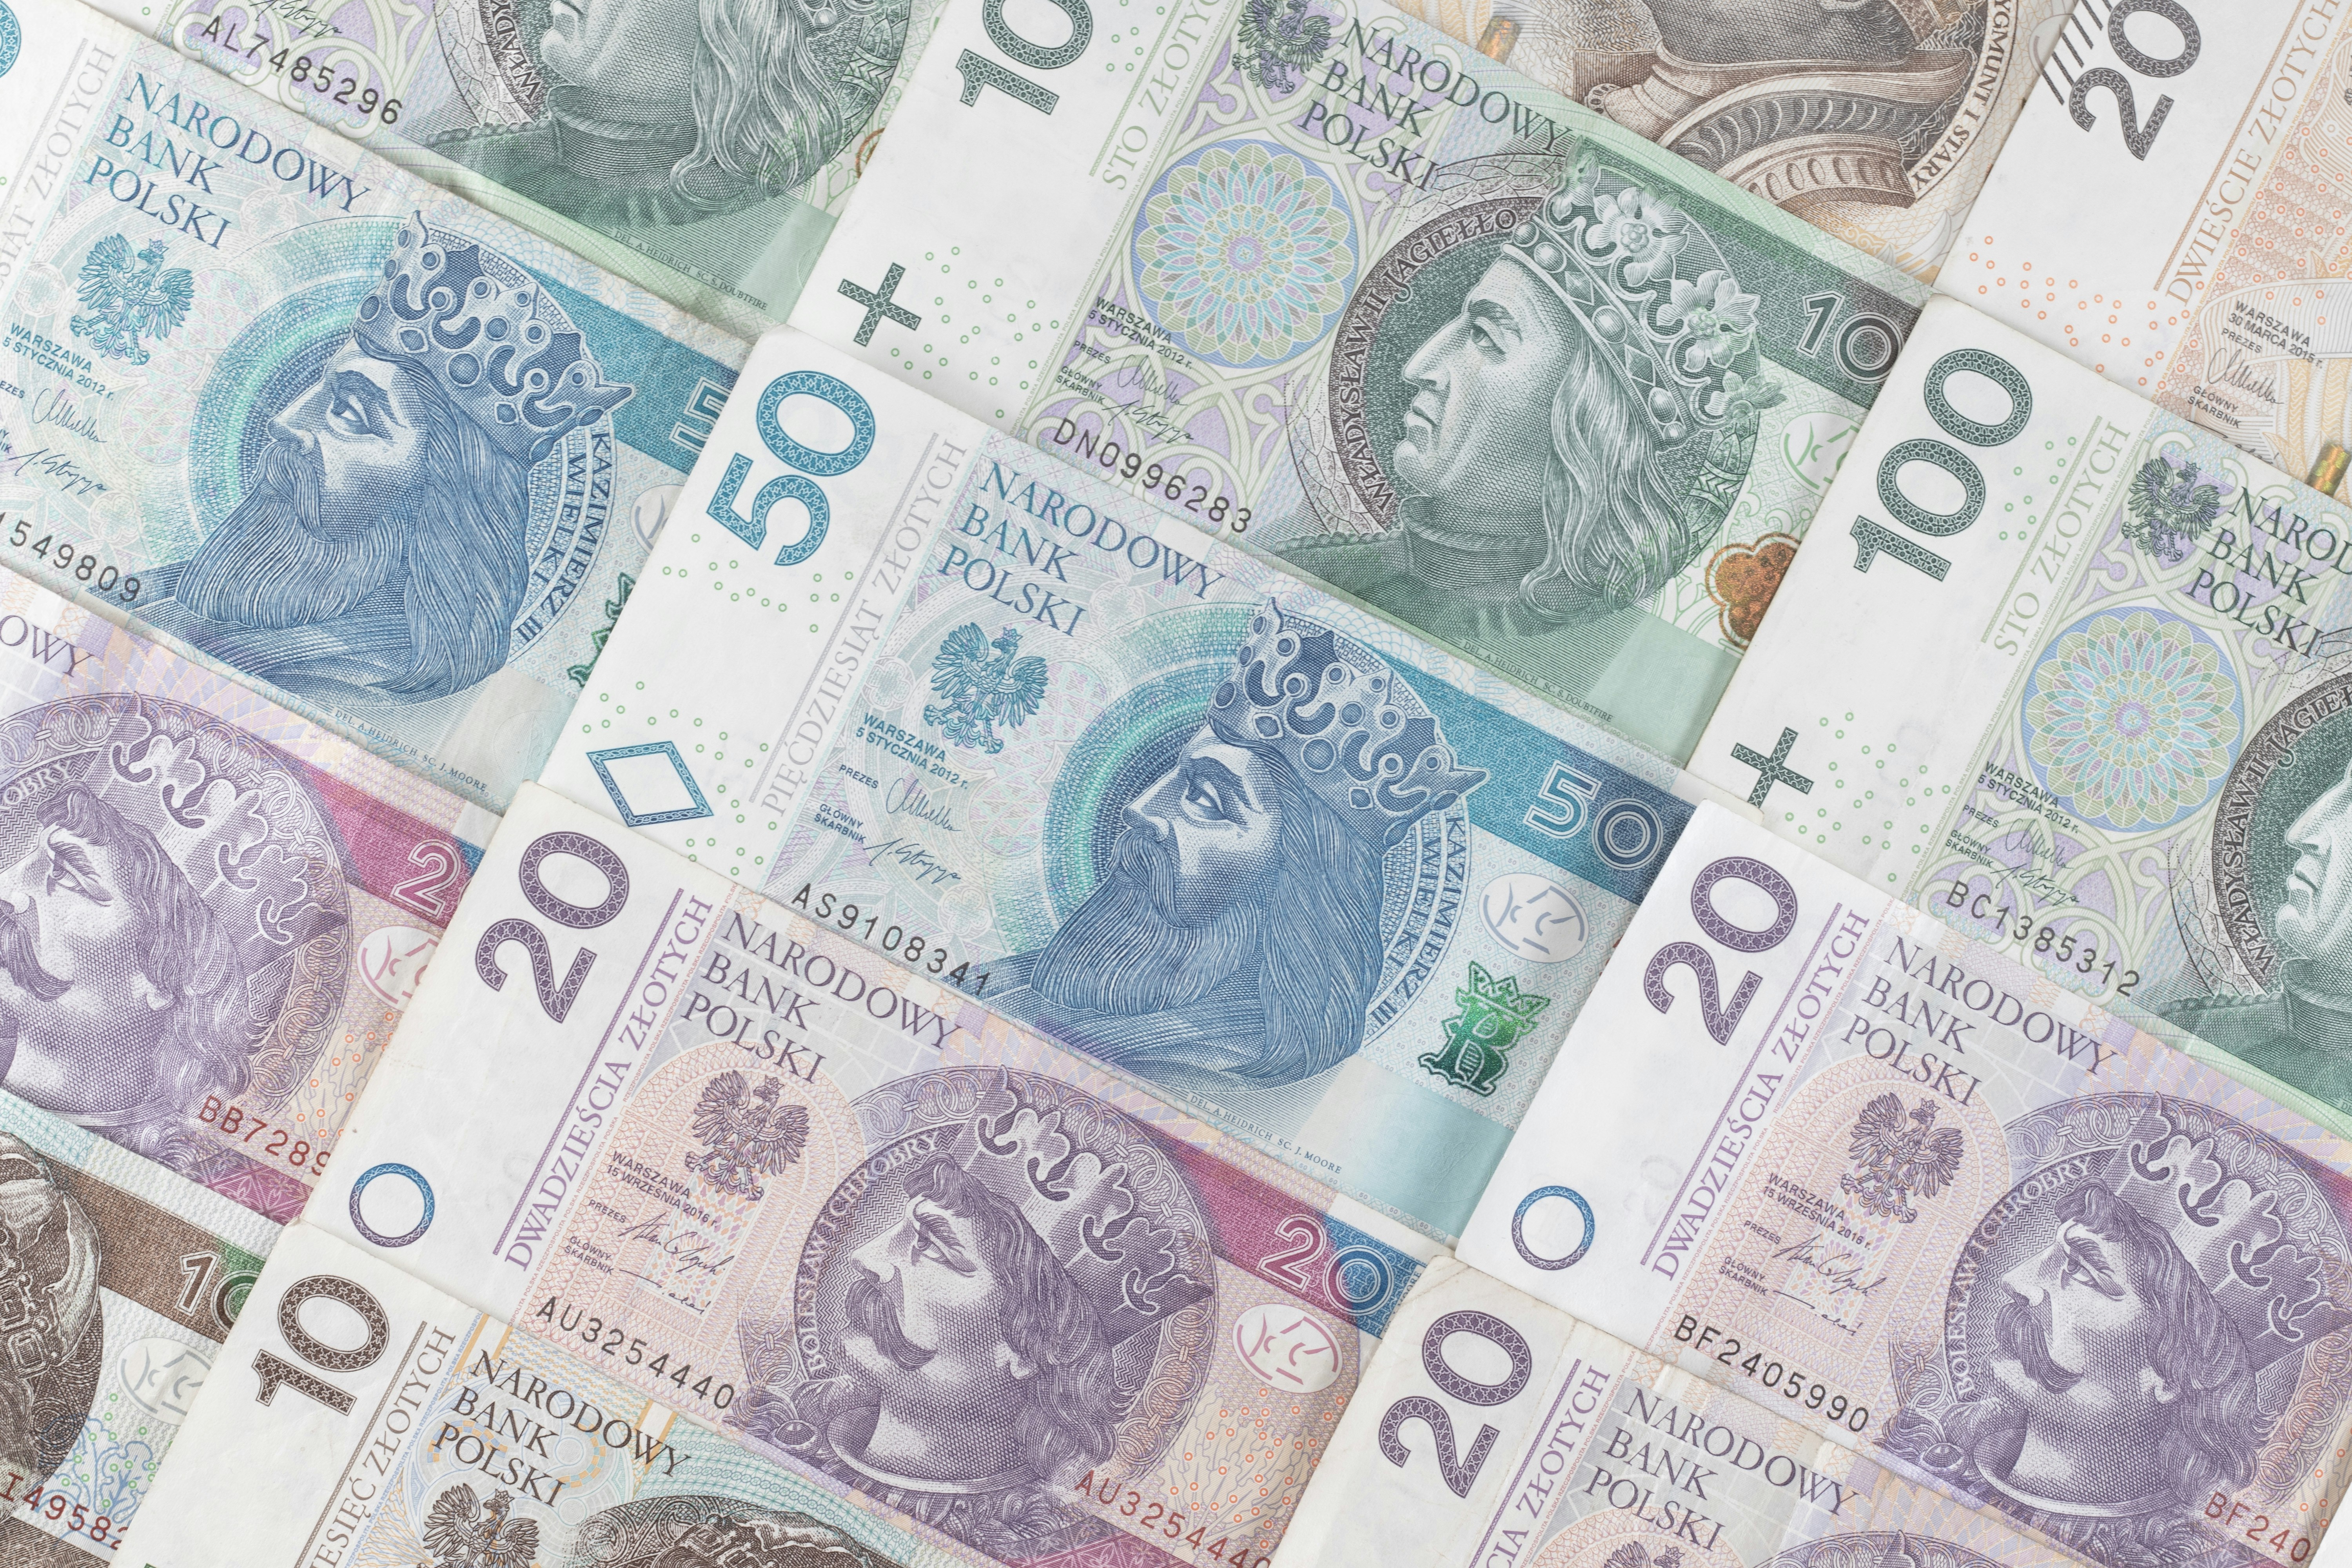
Previsão de Dólar para Zloty para 2025, 2026, 2027, 2028 - 2030: Previsão de USD para PLN
Previsão do dólar para o zloty 2025 - 2030 Compreender a dinâmica do mercado cambial é fundamental tanto para investidores novatos quanto expe...
08.11.2024 03:53
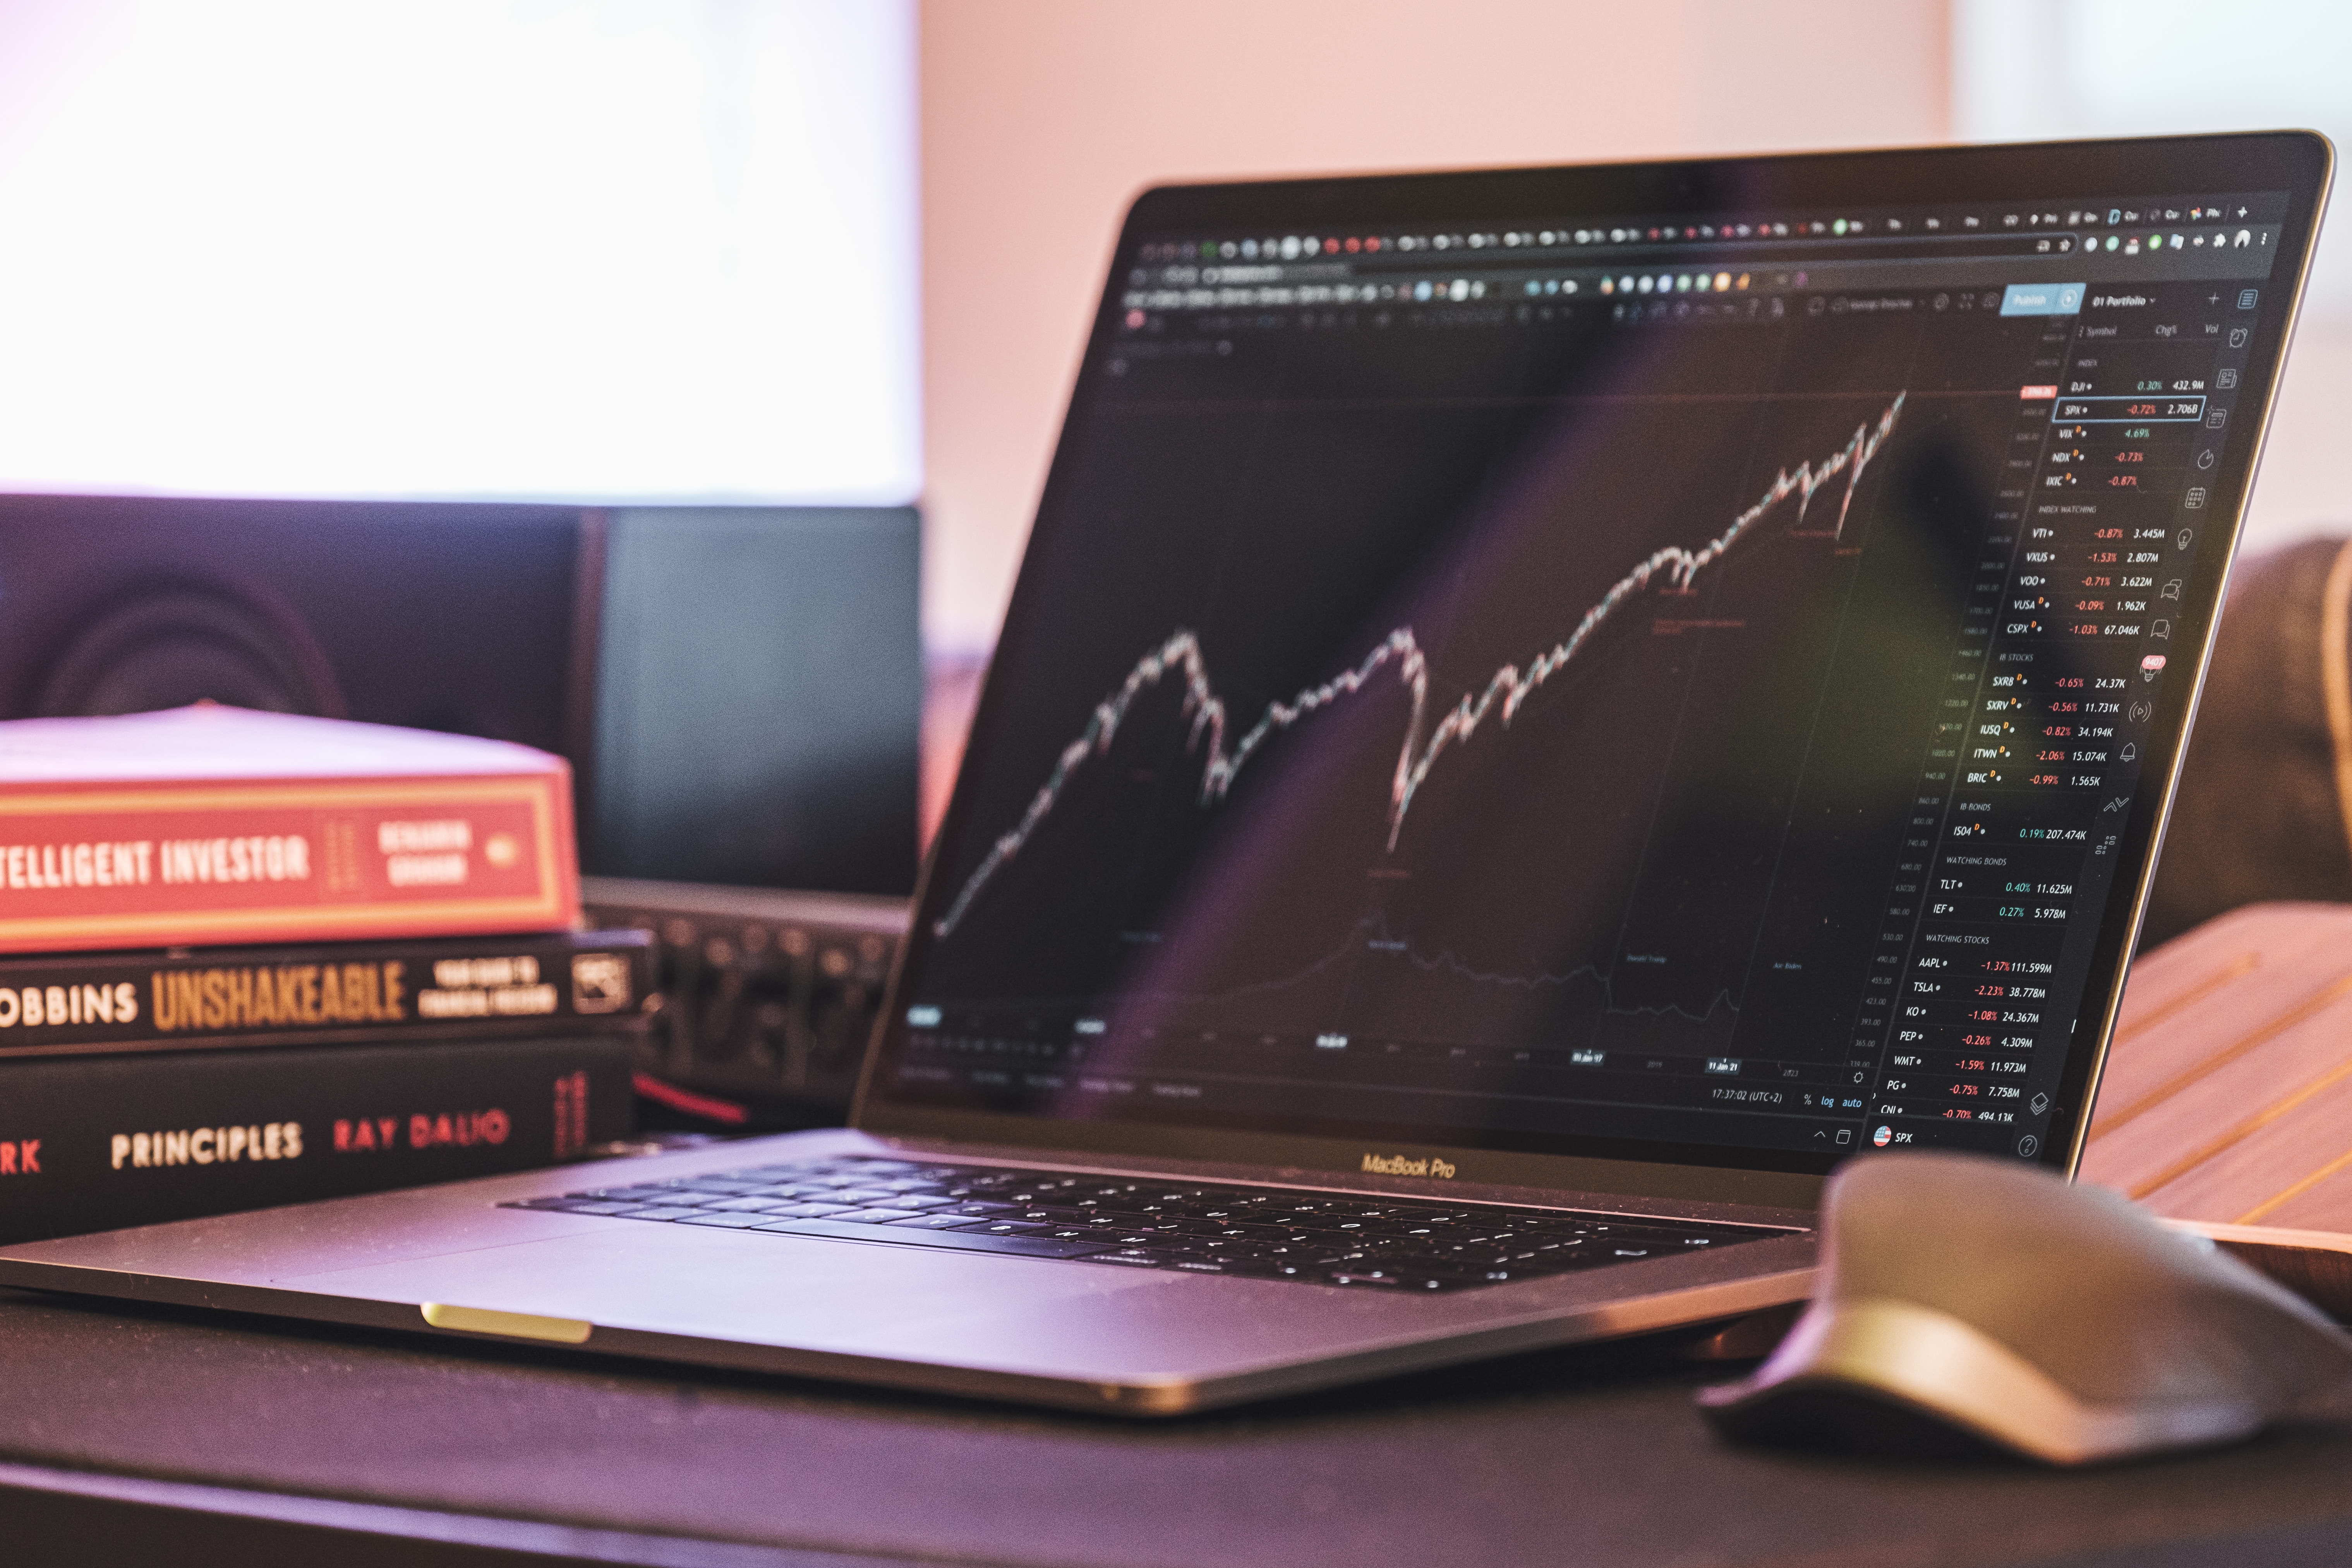
Como criar um robô forex em MT4 e MT5
Como criar um robô forex em MT4 e MT5 Índice de conteúdo INTRODUÇÃO PRINCIPAIS CONCLUSÕES COMPREENDER OS ROBÔS FOREX E OS CONSULTORES ESPECIA...
29.10.2024 18:33

GBP (libra esterlina) Previsões e Prognósticos para 2025 e anos seguintes
Previsão da GBP para 2025 e anos seguintes Compreender o papel da libra esterlina é crucial à medida que nos aprofundamos nas previsões ...
23.10.2024 06:20
Preço médio ponderado por volume (VWAP) - Significado e cálculo
VWAP Índice: PRINCIPAIS CONCLUSÕES O QUE É VWAP? IMPORTÂNCIA DO PREÇO MÉDIO PONDERADO PELO VOLUME COMO CALCULAR O VWAP COMO UTILIZAR O PREÇ...
26.08.2024 17:36
Padrões harmónicos explicados para iniciantes
Padrões harmónicos Índice: PRINCIPAIS CONCLUSÕES O QUE SÃO PADRÕES HARMÓNICOS? PROBLEMAS COM HARMÓNICOS TIPOS DE PADRÕES HARMÓNICOS PORQUE ...
22.08.2024 12:10
Alavancagem Operacional - Definição, Fórmula e Exemplos
Alavancagem operacional Índice: PRINCIPAIS CONCLUSÕES O QUE É ALAVANCAGEM OPERACIONAL? FÓRMULA DE ALAVANCAGEM OPERACIONAL EXEMPLO DE ALAVANC...
21.08.2024 11:01
Take-Profit Order - Definition and Examples
Ordem de recolha de lucros Índice: O QUE É UMA ORDEM TAKE PROFIT? COMO FUNCIONA UMA ORDEM TAKE PROFIT? EXEMPLO DE ORDEM DE OBTENÇÃO DE LUCRO ...
09.07.2024 14:44
)
O que é o Forex? Um guia para principiantes
O que é o Forex? Um Guia para Principiantes O Mercado Cambial, vulgarmente designado por Forex, actua como a base do comércio e investimento m...
09.06.2024 14:37
Teoria das Ondas de Elliott - O que é e como funciona
Teoria das ondas de Elliott Índice O QUE É A TEORIA DAS ONDAS DE ELLIOTT? PRINCIPAIS CONCLUSÕES O QUE É O PRINCÍPIO DAS ONDAS DE ELLIOTT? QU...
04.06.2024 16:23
DKK para PLN: Previsão e Previsões da Coroa Dinamarquesa para o Zloty para 2025 e Além
DKK para PLN Previsão: Coroa dinamarquesa para Zloty Taxa de Câmbio Previsão A previsão da taxa de câmbio da coroa dinamarquesa tem tido um in...
14.04.2024 03:36
Previsão de gás natural e previsões de preços para 2025, 2030 e além
Previsões para o gás natural e previsões de preços para 2025, 2030 e além Índice Principais conclusões Previsão e projeção dos preços do gás n...
09.04.2024 00:21
Previsão da taxa SEK para USD para 2025, 2026 e além
Pronóstico da SEK face ao USD para 2025 e mais adiante Sendo uma das principais moedas da zona europeia e uma das 20 principais moedas nacio...
05.03.2024 08:02
Como comprar ações da SpaceX em 2025
Como comprar acções da SpaceX em 2025 Em 2023, muitos estão interessados em investir no espaço, comprando acções da SpaceX. Esta empresa, lide...
10.01.2024 22:06
Horário do Mercado Forex - Qual é o horário de abertura das negociações?
Horário do mercado Forex Se é um negociador forex experiente ou se está apenas a planear entrar neste mercado financeiro, não o pode fazer sem...
08.10.2023 05:28
)
EBIT vs. EBITDA: Definição, fórmula e como calcular
EBIT vs. EBITDA: Definição e Fórmula O EBITDA e o EBIT, que significam resultados antes de juros, impostos, depreciação e amortização, são dua...
14.08.2023 16:19
Significado e tipos de velas Doji: Libélula, Lápide, Estrela, etc.
Vela Doji Quando os comerciantes analisam o mercado, baseiam-se em padrões que se formam nos gráficos de preços, e as velas doji são um dos in...
18.07.2023 14:08
O que é alavancagem em negociação e como ela funciona?
O que é a alavancagem na negociação e como funciona? Para muitos, negociar com alavancagem é simultaneamente aliciante e intimidante. Esta fer...
06.06.2023 09:47