VWAP

Índice:
PRINCIPAIS CONCLUSÕES
O QUE É VWAP?
IMPORTÂNCIA DO PREÇO MÉDIO PONDERADO PELO VOLUME
COMO CALCULAR O VWAP
COMO UTILIZAR O PREÇO MÉDIO PONDERADO POR VOLUME (VWAP)
EXEMPLOS DE VWAP EM AÇÃO
LIMITAÇÕES DO VWAP
CONCLUSÃO
FAQS
Muitos indicadores na negociação ajudam a tomar as decisões corretas no mercado. Este artigo é dedicado a um desses indicadores - VWAP (preço médio ponderado pelo volume). O VWAP ajuda os investidores a determinar a tendência e a encontrar um ponto de entrada ou um ponto de fecho de posição. Neste artigo, também discutiremos como o preço médio ponderado VWAP é calculado, como usar este índice e mostraremos exemplos e limitações desta métrica.
PRINCIPAIS CONCLUSÕES:
- O VWAP é uma métrica técnica utilizada para determinar a tendência do mercado.
- O preço médio ponderado pelo volume é calculado a partir do preço médio multiplicado pelo volume de transacções num determinado momento.
- O VWAP pode servir como confirmação adicional de uma tendência de baixa ou de alta, no entanto, a sua presença por si só não lhe dará muito, pois deve ser combinada com outras métricas.
- O preço médio ponderado VWAP é geralmente mais útil para os operadores de curto prazo.
O QUE É VWAP?
VWAP (Volume Weighted Average Price) é um índice de análise técnica que mostra o valor típico do preço calculado pela média aritmética dos máximos, mínimos e preço de fecho de uma vela e por volume. A métrica mostra o valor médio num dia durante uma sessão de negociação. O VWAP fornece aos investidores informações importantes sobre a tendência e o valor de uma ação.
O preço médio ponderado VWAP compreende o montante total de capital em cada transação e depois dividido pelo número total de transacções.
IMPORTÂNCIA DO PREÇO MÉDIO PONDERADO PELO VOLUME
O VWAP tem várias aplicações importantes e, para que esta métrica o ajude na negociação, é necessário compreender para que foi criada.
1. Pode indicar se o mercado está em baixa ou em alta
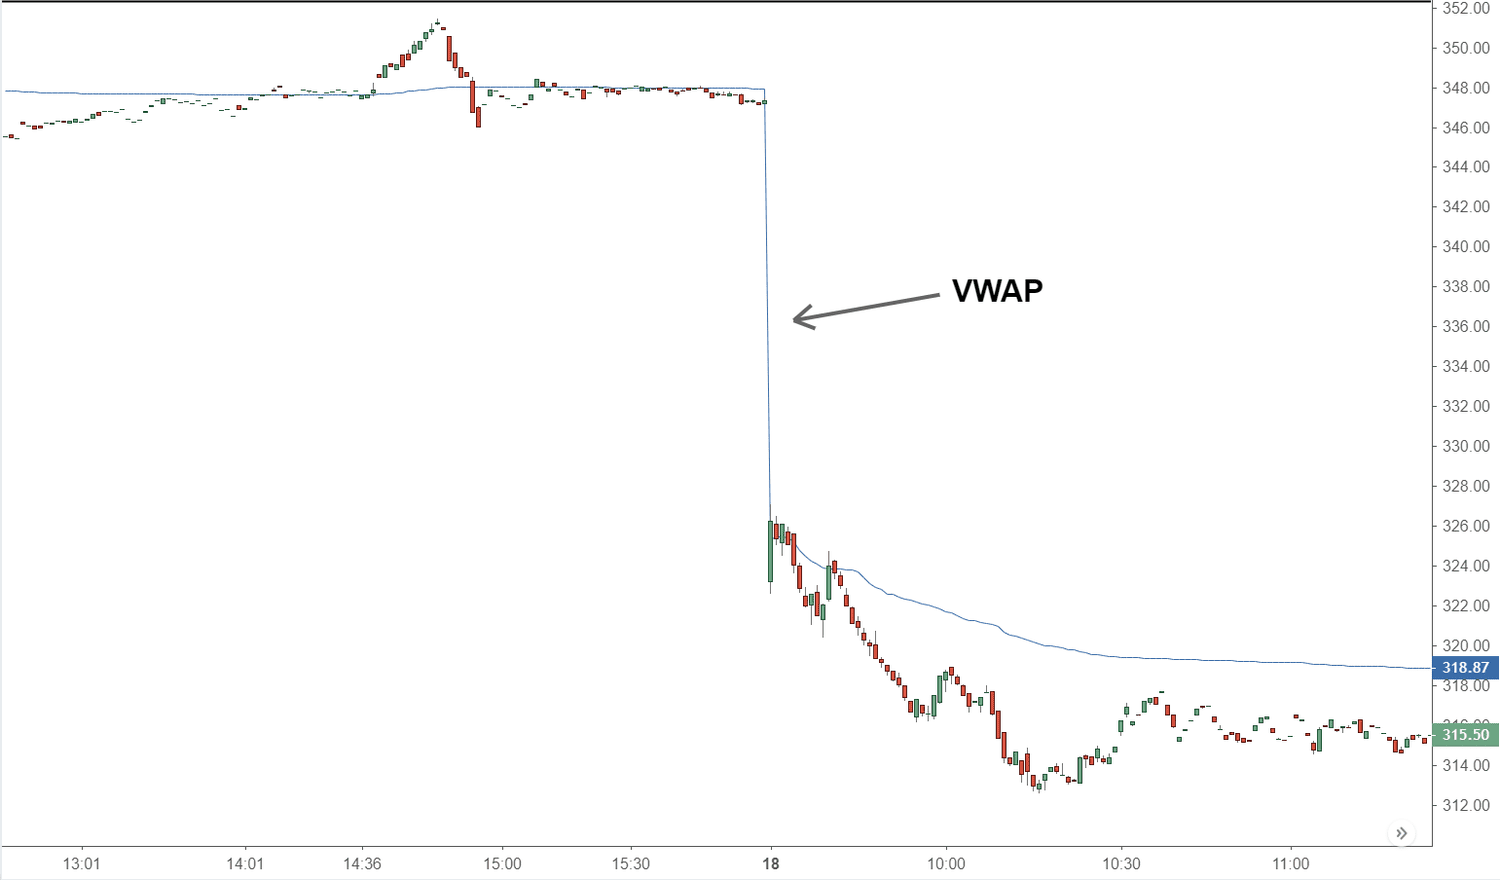
O VWAP pode ser um ótimo indicador de um mercado em baixa ou em alta. Se a ação estiver a ser negociada acima do preço médio ponderado pelo volume, a tendência é de alta, se estiver abaixo, a tendência é de baixa. Em seguida, dependendo de onde o ativo está a ser negociado, o investidor pode entrar em posições longas ou curtas.
O VWAP pode ser um nível de suporte ou resistência para um comerciante, o volume também desempenha um papel. Se virmos um grande volume de transacções acima da métrica, trata-se de um impulso de alta. Se houver um grande volume abaixo do preço médio ponderado pelo volume, será um impulso de baixa.
Em geral, o preço médio ponderado VWAP pode ajudar a determinar a direção da tendência, mas não pode prever com precisão se o mercado está em baixa ou em alta. Para uma análise mais exacta, é necessário utilizar outras ferramentas e índices.
2. Saberá quando vender ou comprar
Embora uma decisão de compra ou venda não possa ser tomada com base apenas no índice, o VWAP pode servir como uma ferramenta auxiliar na sua negociação e confirmar ou refutar a sua hipótese.
Pode ser tomada uma decisão de compra com base no indicador VWAP se: a linha do gráfico da ação ultrapassar o índice com um volume elevado; se o valor da ação tocar o preço médio ponderado do volume e o ultrapassar com um volume elevado; se a média ponderada do volume ultrapassar a média móvel em alta, isto pode indicar uma mudança na tendência de crescimento e pode ser um sinal de compra.
Uma decisão de venda pode ser tomada se: a ação ultrapassar o índice com um volume elevado; se a linha do gráfico saltar para baixo do índice com um volume elevado.
3. É uma ferramenta melhor do que a média móvel
A média móvel e o preço médio ponderado VWAP são ferramentas diferentes que apresentam valores ligeiramente diferentes. A média móvel tem em conta apenas o preço típico da ação durante um determinado período, enquanto o preço médio ponderado por volume tem também em conta o volume, que desempenha um papel igualmente importante na determinação do preço. Em geral, a média móvel e o VWAP são utilizados aproximadamente para os mesmos fins - para determinar a tendência, encontrar o ponto de entrada.
COMO CALCULAR O VWAP
Na maioria dos casos, não terá de efetuar um cálculo VWAP, uma vez que este VWAP ancorado está nos serviços de negociação. Mas se quiser fazer o cálculo do VWAP por si próprio, aqui estão os passos a seguir:
- Primeiro, a fórmula VWAP consiste no valor típico para os primeiros cinco minutos de negociação. Para isso, some o máximo, o mínimo do candle de 5 minutos e o preço de fechamento desse candle, e divida tudo por 3. Multiplique o número resultante pelo volume de negociação desse período.
- Dividir este número pelo volume deste período. Isto criará um índice.
- Ao calcular o VWAP durante o dia, adicione os valores restantes ao número do ponto 1 e divida-o pelo volume total de negociação até esse momento.

COMO UTILIZAR O PREÇO MÉDIO PONDERADO POR VOLUME (VWAP)
Imagine um gráfico de preços com uma linha significativa que representa este índice. À medida que o gráfico se aproxima desta linha, podemos observar o seu comportamento. Por exemplo, podemos ver um período de consolidação próximo do preço médio ponderado pelo volume, seguido de uma quebra acima ou abaixo da linha. Esta quebra pode indicar uma mudança na dinâmica, potencialmente levando a uma tendência.
Se a linha do gráfico se mover abaixo do VWAP e fechar rapidamente acima dele, isso pode sinalizar um aumento da atividade de compra. Isto pode encorajar os investidores a considerar uma posição longa, com uma ordem de paragem abaixo de um ponto baixo anterior.
No entanto, a interpretação desta métrica nem sempre é direta. Por vezes, o mercado pode quebrar abaixo da banda inferior ou acima da banda superior, criando uma dinâmica diferente. É crucial observar o contexto e combinar o VWAP com outros indicadores técnicos, como o Índice de Força Relativa (RSI) ou as médias móveis, para uma compreensão mais abrangente do mercado.
EXEMPLOS DE VWAP EM AÇÃO
O VWAP, ou Preço Médio Ponderado pelo Volume, é um elemento-chave nas finanças empresariais, particularmente nas recompras de acções e nas fusões e aquisições. Quando uma empresa como a Guess utiliza um acordo de recompra acelerada de acções (ASR), o VWAP determina o número final de acções recompradas, garantindo um valor justo no meio das flutuações do mercado.
Em fusões como a aquisição da Life Storage pela Public Storage, o preço médio ponderado pelo volume é utilizado para calcular o rácio de troca, garantindo uma avaliação justa para ambas as empresas com base no seu histórico de negociação recente.
LIMITAÇÕES DO VWAP
O preço médio ponderado pelo volume tem as suas limitações. Uma delas é o facto de o índice calcular o valor médio num dia; as tentativas de calcular o valor médio para vários dias podem levar a um resultado errado. O VWAP não é a única marca de uma tendência, não dá uma compreensão de quando uma tendência vai começar e quando vai desaparecer, portanto, é impossível prever uma tendência com antecedência usando apenas uma métrica. Se a linha do gráfico ultrapassar o preço médio ponderado pelo volume, então a tendência já começou.
CONCLUSÃO
Embora o preço médio ponderado pelo volume seja um indicador muito útil, não deve construir toda a sua estratégia de negociação em torno de um indicador. Para negociar eficazmente e sair do mercado com dinheiro, a sua estratégia deve consistir em muitos factores de análise técnica e fundamental.
FAQS
O que é que o VWAP lhe diz?
O VWAP pode indicar o início de uma tendência forte ou mostrar um ponto de entrada.
O VWAP é um indicador importante?
É um dos principais indicadores, mas deve ser utilizado em conjunto com outros indicadores e métricas.
O que é a estratégia VWAP?
Se a linha do gráfico quebrar o preço médio ponderado pelo volume com um grande volume, isso indica o início de uma forte tendência e pode procurar transacções. Se a linha do gráfico saltar do VWAP com um grande volume, então isto pode servir como um ponto de entrada.
O VWAP está em alta ou em baixa?
O indicador pode ser utilizado tanto em períodos de baixa como de alta.
Qual é a taxa de sucesso do VWAP?
O VWAP não tem uma taxa de sucesso específica, uma vez que é uma ferramenta e não uma estratégia. A sua eficácia depende da forma como é utilizado, das condições de mercado e da competência do trader. É frequentemente combinado com outros indicadores para obter melhores resultados.

