Wedge Pattern: Definition, Types, How to Trade
)
Table of Contents
Key Takeaways
Key Characteristics of Wedge Patterns
Types of Wedge Patterns
Timeframes and Pattern Formation
Identifying Wedge Patterns
Trading Strategies for Wedge Patterns
Benefits and Limitations of Wedge Patterns
Examples of Wedge Patterns in Action
Using Wedge Patterns in Market Scanning
Conclusion
FAQs
Ever noticed how price patterns on a chart sometimes look like a slice of pie getting narrower? That's a wedge pattern forming right before your eyes. These converging trend lines create powerful signals that technical analysts use to spot potential reversals in any security's price.
These formations appear when two trend lines squeeze price action into a tighter range. Think of it as the market taking a deep breath before making its next big move. Smart traders watch these patterns closely because they often predict where the price chart will head next.
Key Takeaways
- These chart formations develop when converging trend lines create a narrowing price range
- Rising wedges typically signal bearish reversals, while falling wedges indicate bullish opportunities
- Volume usually declines as the wedge formation develops
- Breakouts happen in the opposite direction of the wedge slope
- Confirmation with trading volume is essential for reliable signals
- These patterns work across multiple timeframes, from day trading to long-term investing
Key Characteristics of Wedge Patterns
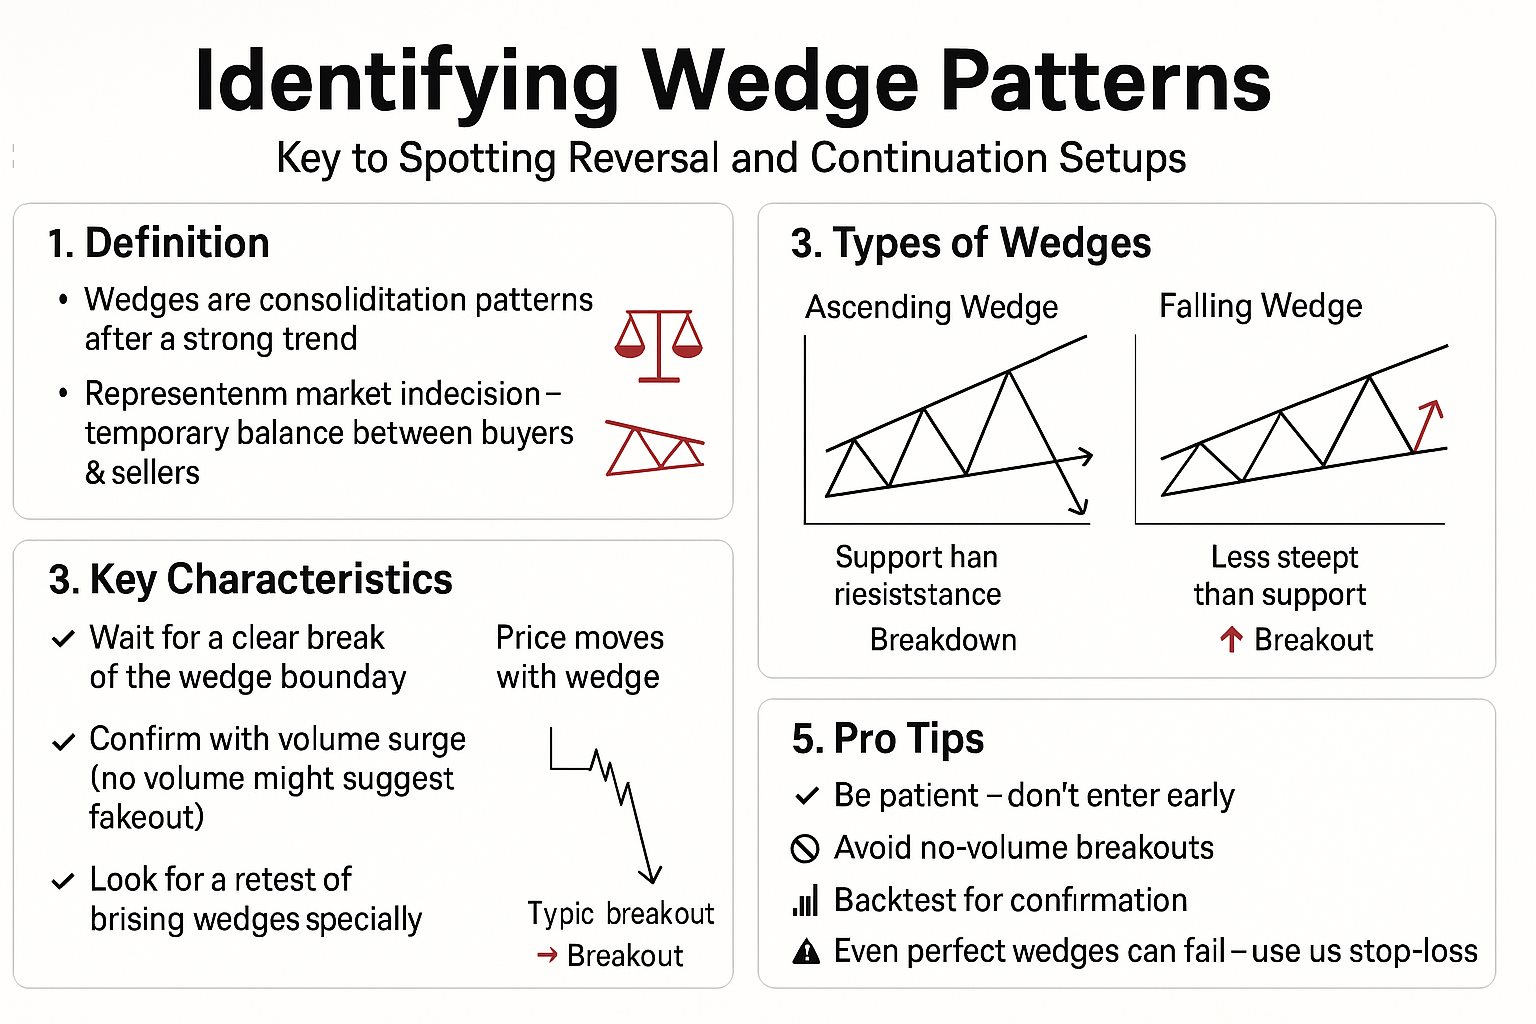
These formations share three defining features that set them apart. First, you'll see two converging trend lines that squeeze price action. Second, declining volume accompanies the pattern as it develops. Third, a decisive breakout emerges from one trend line.
These chart patterns signal either a bullish reversal or bearish reversal ahead. The magic happens when at least two points touch each trend line. Watch for decreasing volume during formation - it's like a coiled spring building tension before release.
Types of Wedge Patterns
The financial markets offer two main types for traders to master. Rising wedges flash bearish signals, while falling wedge patterns point to bullish signals. Let's explore how each type shapes your trading decisions across forex, stocks, and markets.
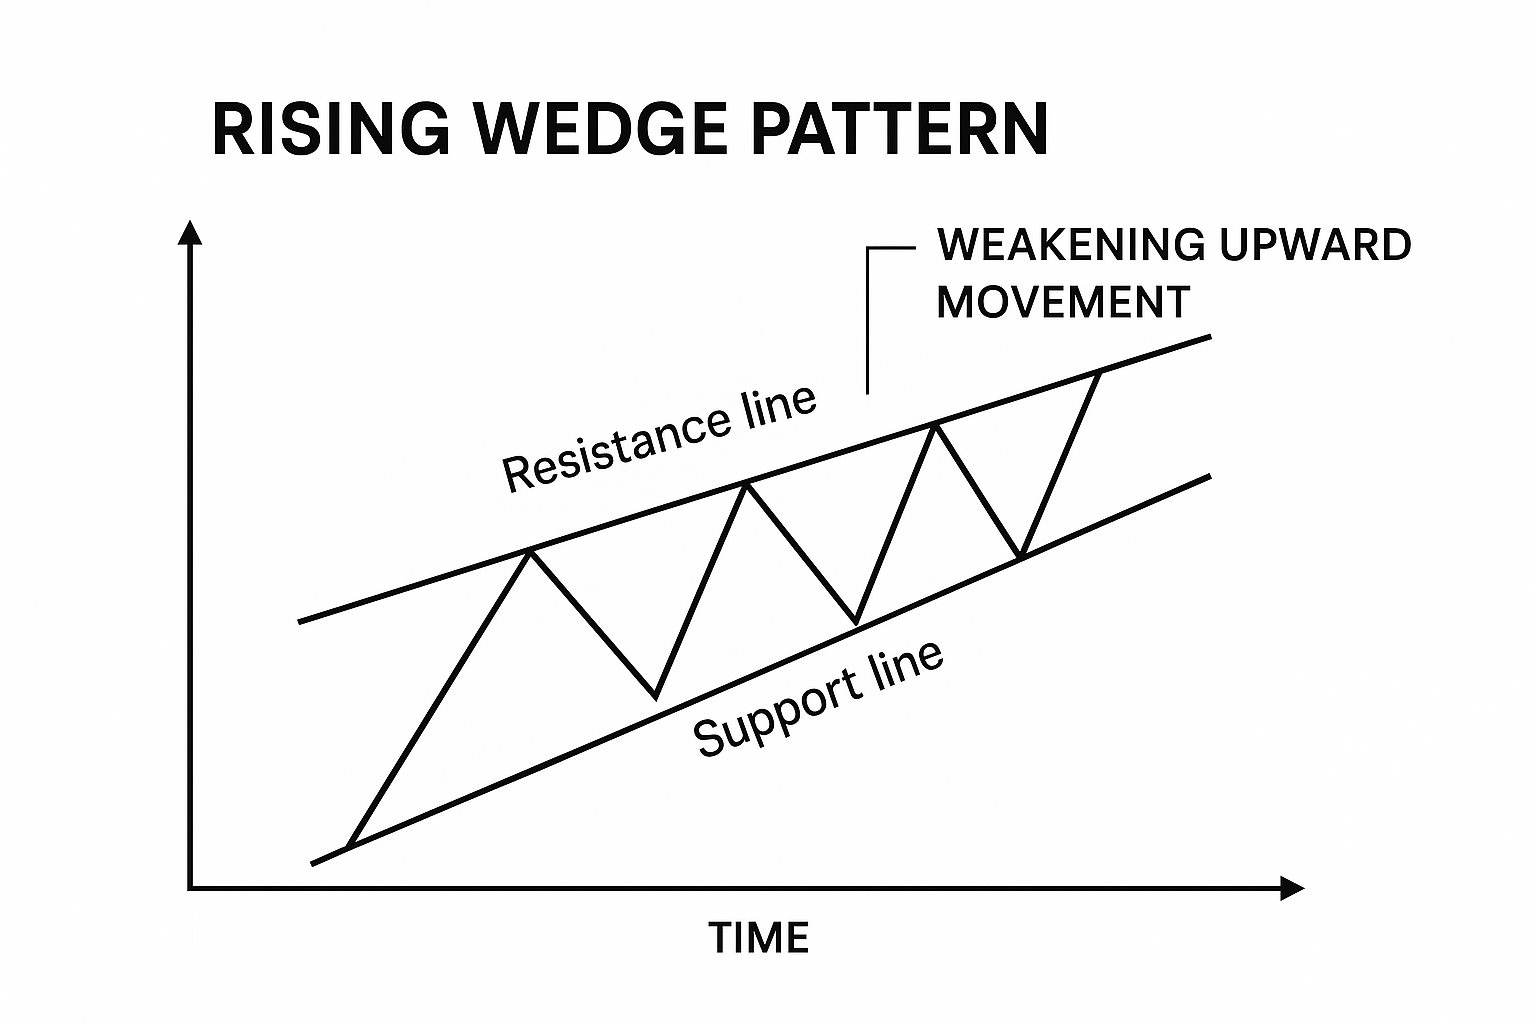
Rising Wedge Pattern
A rising wedge pattern shows price climbing within a narrowing trading range. The upward slope tricks many traders into thinking the bullish trend continues. But here's the catch - this bearish reversal pattern often appears at market tops.
Picture the support line racing upward faster than resistance. This rising or ascending wedge can emerge during uptrends as a reversal pattern. It also shows up in downtrends as a continuation pattern. When price breaks below the lower trend line, bears take control.
Smart traders prepare for the breakout reversal by positioning for short selling. Some use derivatives to amplify their gains. The key is patience - wait for that decisive break below support. Rising wedge patterns love to test traders' nerves before revealing their true direction.
)
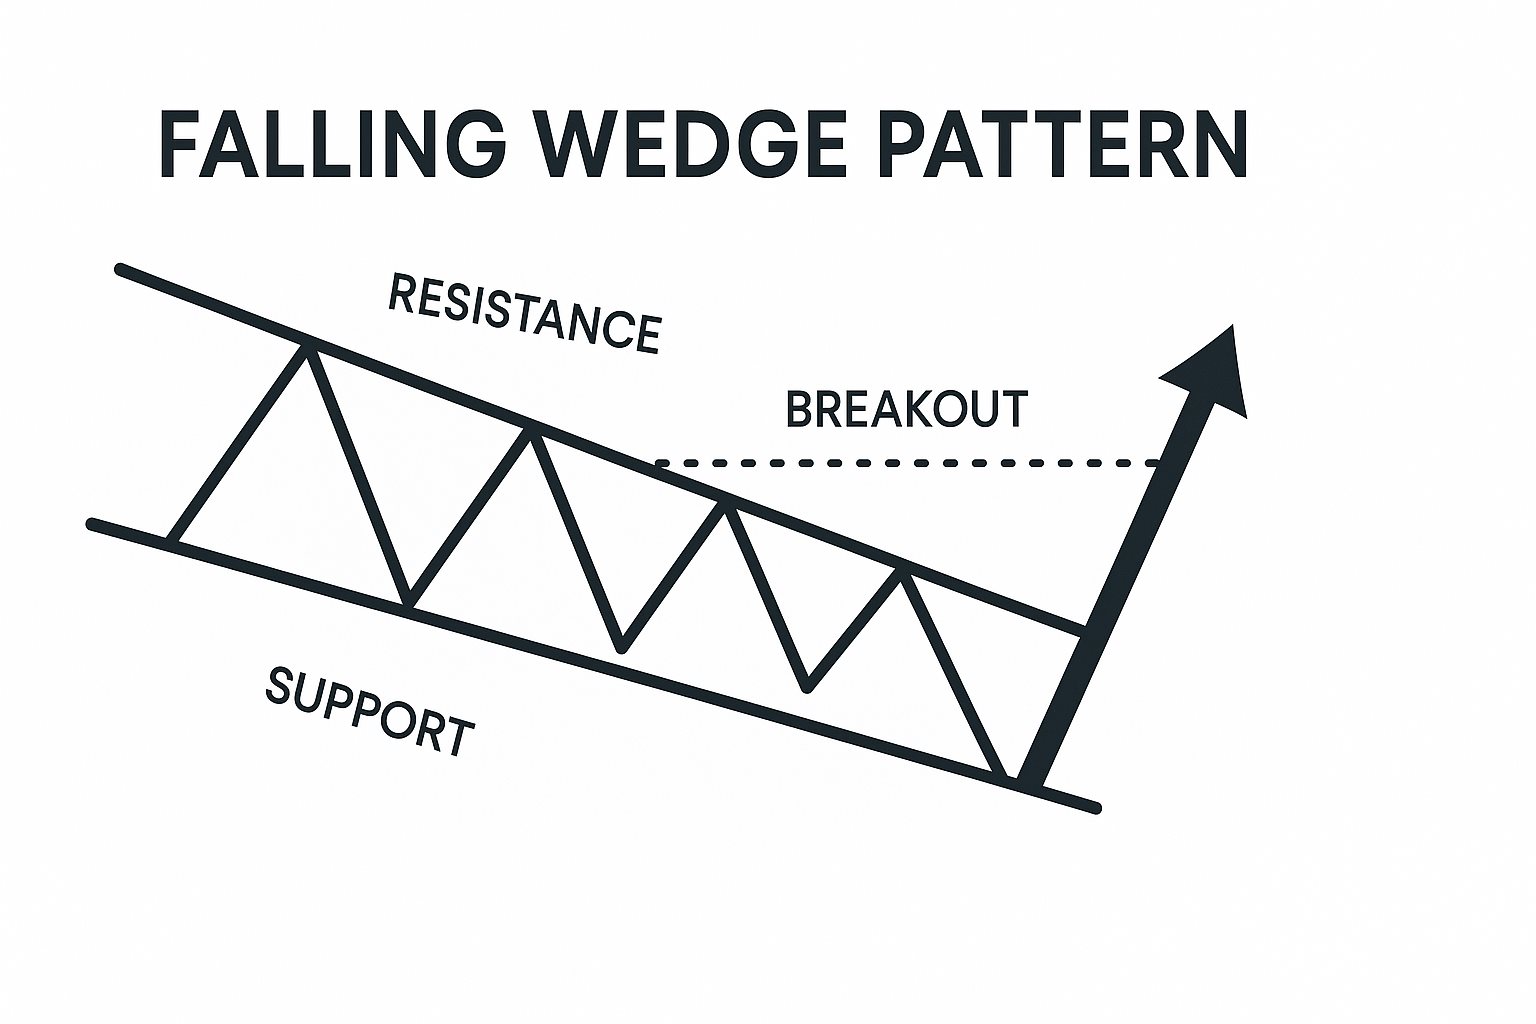
Falling Wedge Pattern
The falling wedge pattern presents a mirror image of its rising cousin. Price slides lower within converging trend lines, creating a downward slope that often fools bearish traders. This bullish chart pattern typically marks the end of downtrends.
Watch how the support line drops faster than resistance. This falling or descending wedge signals that sellers are losing momentum. Buyers start nibbling at lower prices, gradually slowing the price slide. The falling wedge pattern works as both a reversal signal in downtrends and a continuation pattern during uptrends.
When price breaks above the upper trend line, it's game on for bulls. Falling wedges offer excellent risk-reward setups for traders seeking bullish reversal opportunities. The declining price action masks accumulation by smart money.
)
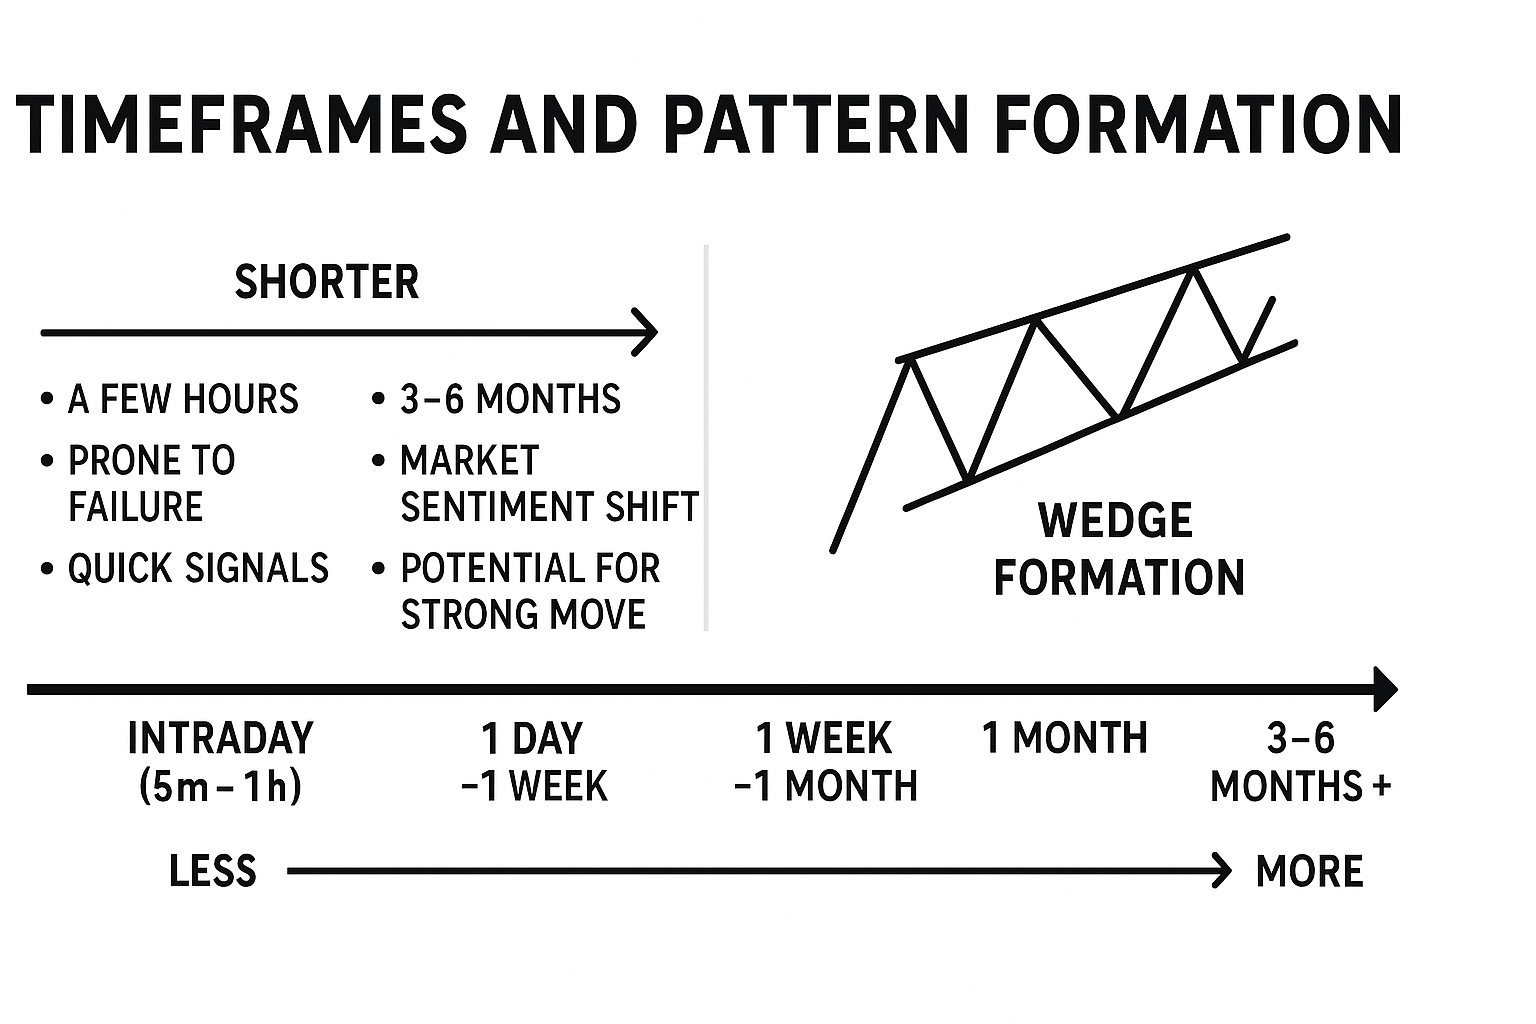
Timeframes and Pattern Formation
Wedge formation doesn't happen overnight - unless you're scalping intraday charts. These patterns develop across various timeframes. Some last mere hours, while others stretch across months-long periods. Day traders often spot mini-wedges on 5-minute charts, though these carry higher failure rates.
The most reliable setups emerge over a three- to six-month period. These extended formations pack more punch because they represent significant market sentiment shifts. Whether signaling an intermediate reversal or long-term reversal, duration matters. Longer patterns typically produce stronger moves, but no timeframe guarantees success.
)
Identifying Wedge Patterns
Spotting these formations requires a keen eye for detail. They emerge from consolidation phases after strong trends. The prior trend weakens as buyers and sellers reach temporary equilibrium.
Look for these telltale signs in your technical analysis. First, ensure both the support line and resistance line converge. Second, confirm price moves in the same direction as the wedge slopes. Third, monitor volume levels - they should decrease as the pattern develops.
Ascending formations show support climbing faster than resistance. Falling wedge patterns display the opposite - support drops quicker than resistance. The breakout direction typically opposes the wedge slope. Bulls win when falling formations break higher. Bears celebrate when ascending patterns crack lower.
Professional traders never rush their entries. They wait for clean breaks of prior support or resistance levels. Strong trading volume must accompany the breakout. Without volume confirmation, that breakout might be a head fake. Watch for retests of broken levels - they often provide better entry points. Rising wedge patterns particularly love to retest before continuing lower. Remember - patience pays in pattern trading, but even perfect setups can fail.
)
Trading Strategies for Wedge Patterns
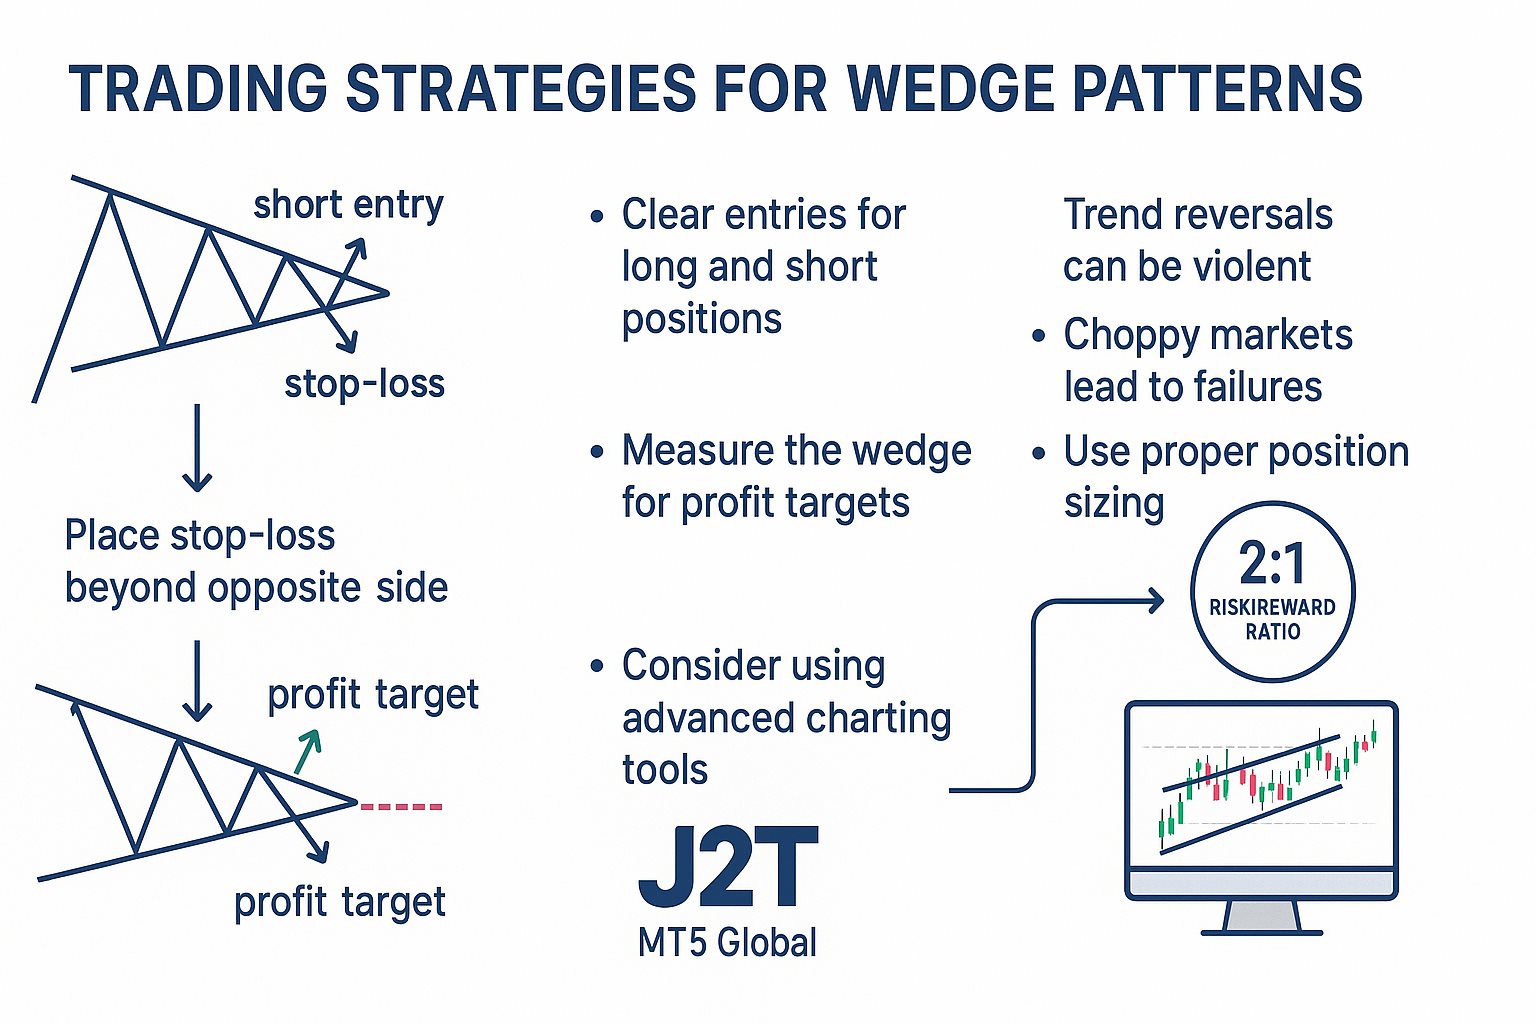
Trading wedge patterns successfully demands a solid game plan. These formations provide clear entry signals for both long and short positions. The converging trend lines create natural boundaries for risk management.
Set your stop-loss order just beyond the wedge's opposite side. This approach limits losses if the pattern fails. For profit targets, measure the wedge's widest point and project that distance from the breakout. Some traders prefer trailing stop losses to capture extended moves.
Never forget that trend reversals can be violent. These chart patterns often precede sharp price movements. That's why position sizing matters - don't bet the farm on any single setup. Maintain healthy risk-to-reward ratios of at least 2:1. Many wedge patterns fail, especially in choppy markets.
Want to level up your wedge trading? Consider using J2T's MT5 Global platform for advanced charting tools. The platform helps you spot these patterns across multiple markets simultaneously.
Benefits and Limitations of Wedge Patterns
Price pattern strategies offer unique advantages for active traders. The converging nature of these formations allows tighter stop loss placement than other setups. This feature improves your risk-reward ratio significantly.
However, these trading systems aren't foolproof. These patterns sometimes resemble triangles or flags, causing confusion. Buy-and-hold strategies might outperform pattern trading during strong trending markets.
The biggest challenge? Distinguishing real wedges from similar formations. False signals happen when traders misidentify patterns. Always use additional confirmation tools before pulling the trigger. Even experienced traders get fooled by wedge patterns regularly.
Examples of Wedge Patterns in Action
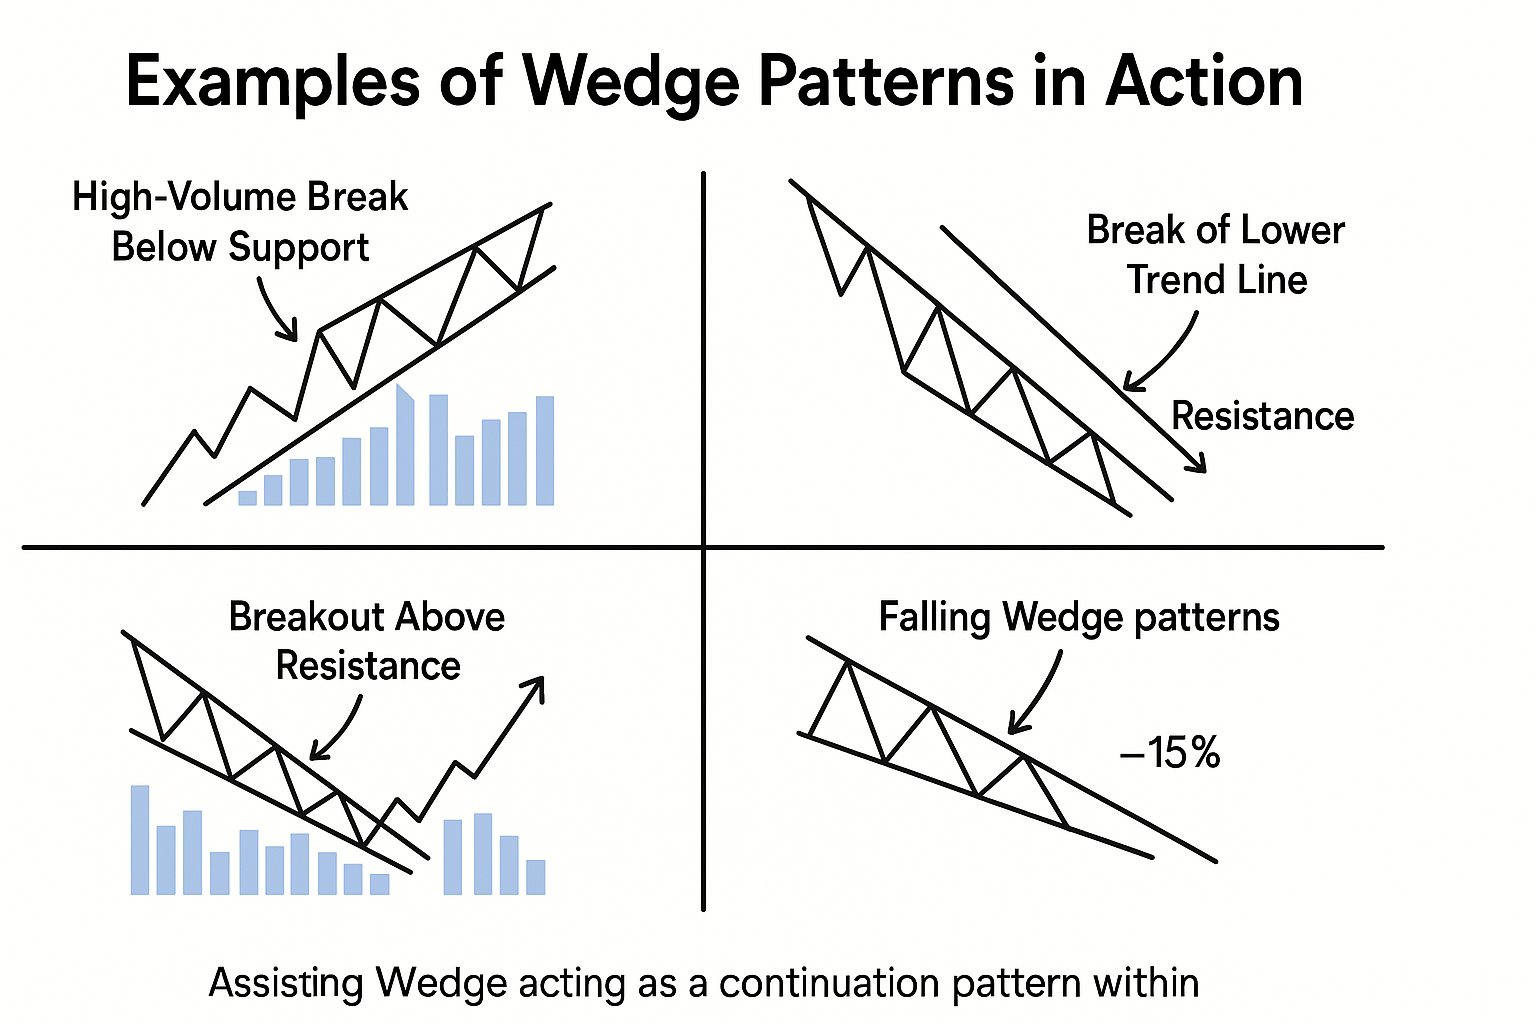
Real-world examples bring wedge pattern theory to life. Consider an ascending formation developing after a strong uptrend in tech stocks. Price tests the support line multiple times while trading volume dwindles. Then boom - a high-volume break below support triggers a 15% decline.
Another scenario involves a rising wedge acting as a continuation pattern within a downtrend. Price rallies into the pattern, giving hope to trapped bulls. But when the lower trend line breaks, the prior downward trend resumes with vengeance. The breakout area becomes a resistance line for future rallies.
Falling wedge patterns tell equally compelling stories. Picture a beaten-down stock forming such a pattern after months of selling. Smart money accumulates quietly as weak hands capitulate. The breakout above resistance sparks a significant relief rally. These setups remind us why pattern recognition matters - when it works.
Using Wedge Patterns in Market Scanning
Modern technology transforms how we find these formations across markets. Specialized stock screening software scans thousands of charts instantly. These tools identify potential setups faster than manual analysis ever could.
Set your scanners to flag stocks showing converging price action with declining volume. This combination often precedes wedge breaks and exciting trading opportunities.
Conclusion
These chart formations remain essential tools in technical analysis for good reason. They help traders identify potential market movements before they unfold. Whether you spot rising wedges signaling bearish reversals or falling wedge patterns pointing to bullish opportunities, knowledge is power.
Success with these patterns requires practice, patience, and proper risk management. Combine these formations with other technical indicators for confirmation. Watch those volume levels closely during breakouts. Most importantly, remember that no pattern works 100% of the time - even textbook setups fail regularly.
Keep learning, keep practicing, and let these powerful chart patterns become another weapon in your trading arsenal. The markets constantly evolve, but these time-tested formations continue delivering opportunities for prepared traders who manage risk wisely.
FAQs
Is a wedge pattern bullish?
Wedge patterns can be either bullish or bearish. Falling wedges typically signal bullish reversals, while rising wedges indicate bearish reversals. The breakout direction usually opposes the wedge's slope.
What are the different types of wedge patterns?
Two main types exist: rising wedges and falling wedges. Rising wedges slope upward and typically break bearish. Falling wedges slope downward and usually break bullish. Both can act as reversal or continuation patterns.
What is the difference between a triangle and a wedge pattern?
Wedges have both trend lines sloping in the same direction. Triangles feature at least one horizontal line. Wedges typically signal reversals, while triangles often indicate continuation of the existing trend.
What is wedge shaped pattern?
A wedge shaped pattern forms when two converging trend lines connect price highs and lows. Both lines slope in the same direction, creating a narrowing cone shape that resembles a wedge.
Is rising wedge always bearish?
Rising wedges break bearish approximately 70% of the time. Strong uptrends can override the pattern, especially with high-volume breakouts above resistance. Context and volume confirmation matter more than the pattern alone.
How do you identify a falling wedge pattern?
Look for declining prices within converging downward-sloping trend lines. The support line must fall faster than resistance. Volume should decrease during formation. Confirm with a breakout above the upper trend line.