Trading accounts
Platforms
News
We provide the latest news
from the world of economics and finance
We provide the latest news from the world of economics and finance
Ford Motor (NYSE:F) is set to report its earnings on May 5, 2025. Consensus projects earnings of about $0.01 per share, down from $0.49 per share in the year-ago quarter, while revenues are likely to come in at about $35.3 billion, down 11.6% compared to the last year. Ford has already reported its vehicle delivery numbers for the U.S. for Q1, noting a 1.3% year-over-year decline, due to the discontinuation of some models as well as the timing of certain rental fleet sales. In comparison, Ford’s principal rival GM reported 17% year-over-year growth in U.S. sales for Q1 2025. However, Ford’s sales of pickup trucks such as the Maverick, Ranger, and F-Series rose 25% and this is likely to have helped soften the impact on margins and profitability.
The company has $38 billion in current market capitalization. Revenue over the last twelve months was $185 Bil, and it was operationally profitable with $5.2 Bil in operating profits and net income of $5.9 billion. That said, if you seek upside with lower volatility than individual stocks, the Trefis High-Quality portfolio presents an alternative, having outperformed the S&P 500 and generated returns exceeding 91% since its inception.
See earnings reaction history of all stocks
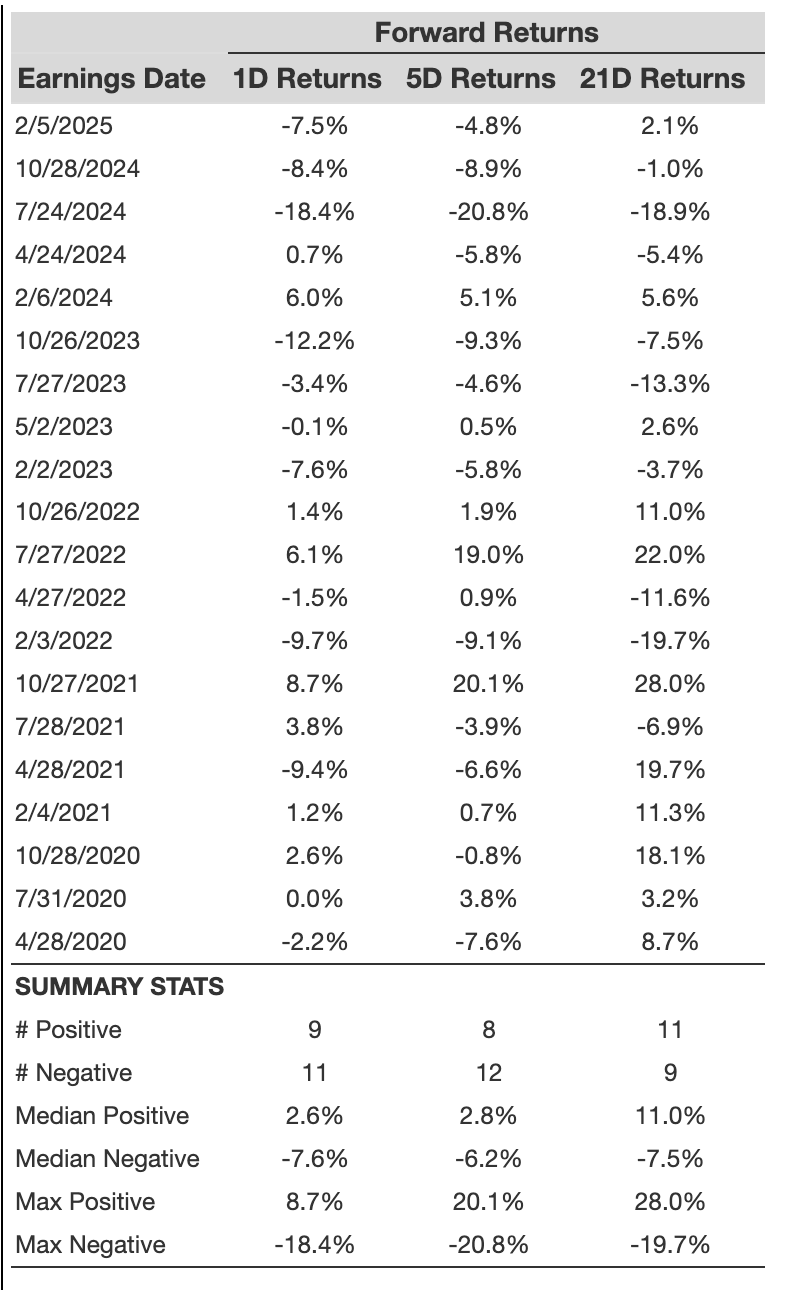
Ford Motor’s Historical Odds Of Positive Post-Earnings Return
Some observations on one-day (1D) post-earnings returns:
Additional data for observed 5-Day (5D), and 21-Day (21D) returns post earnings are summarized along with the statistics in the table below.
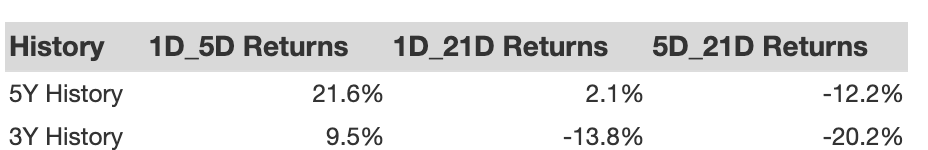
Correlation Between 1D, 5D, and 21D Historical Returns
A relatively less risky strategy (though not useful if the correlation is low) is to understand the correlation between short-term and medium-term returns post earnings, find a pair that has the highest correlation, and execute the appropriate trade. For example, if 1D and 5D show the highest correlation, a trader can position themselves “long” for the next 5 days if the 1D post-earnings return is positive. Here is some correlation data based on a 5-year and a 3-year (more recent) history. Note that the correlation 1D_5D refers to the correlation between 1D post-earnings returns and subsequent 5D returns.
Learn more about Trefis RV strategy that has outperformed its all-cap stocks benchmark (combination of all 3, the S&P 500, S&P mid-cap, and Russell 2000), to produce strong returns for investors. Separately, if you want upside with a smoother ride than an individual stock like Ford Motor, consider the High Quality portfolio, which has outperformed the S&P, and clocked >91% returns since inception.
Invest with Trefis Market Beating Portfolios
See all Trefis Price Estimates
The views and opinions expressed herein are the views and opinions of the author and do not necessarily reflect those of Nasdaq, Inc.
© 2025 Lime Trading (CY) Ltd
Lime Trading (CY) Ltd is authorised and regulated by the Cyprus Securities and Exchange Commission in accordance with license No.281/15 issued on 25/09/2015. The "Just2Trade" trademark is owned by LimeTrading (CY) Ltd.
Registration Number: HE 341520
Address: Lime Trading (CY) Ltd
Magnum Business Center, Office 4B, Spyrou Kyprianou Avenue 78
Limassol 3076, Cyprus
Disclaimer:
All promotions, materials and information of this website may have applied conditions. Please contact the Company for further details
Trading on financial markets carries risks. The value of the investments can both increase and decrease and the investors may lose all their investment capital. In case of a leveraged product, the loss may be more than the initial capital invested. Detailed information on risks associated with trading on financial markets can be found in General Terms and Conditions for the Provision of Investment Services.
E-mail: 24_support@j2t.com