Trading accounts
Platforms
News
We provide the latest news
from the world of economics and finance
We provide the latest news from the world of economics and finance
Pfizer (NYSE:PFE) is scheduled to report earnings on Tuesday, April 29, 2025. Looking at PFE’s five-year history, the stock has shown an exact 50-50 split between positive and negative returns following earnings announcements. When positive, the stock has delivered a median one-day return of 2.7%, with a maximum one-day gain of 6.1%.
Analysts expect earnings of $0.68 per share on sales of $14.11 billion, representing a decline from the prior-year quarter’s earnings of $0.82 per share on sales of $14.88 billion. Vyndaqel will be the key growth driver for Pfizer, likely driving a double-digit sales growth for Pfizer excluding the Covid-19 products.
While post-earnings stock movement will depend on how results and outlook compare to investor expectations, historical performance data can guide event-driven traders. Two potential approaches include:
Now, if you seek upside with lower volatility than individual stocks, the Trefis High Quality portfolio presents an alternative – having outperformed the S&P 500 and generated returns exceeding 91% since its inception.
See earnings reaction history of all stocks

Image by Jan Felix Christiansen from Pixabay
Some observations on one-day (1D) post-earnings returns:
Additional data for observed 5-Day (5D), and 21-Day (21D) returns post earnings are summarized along with the statistics in the table below.
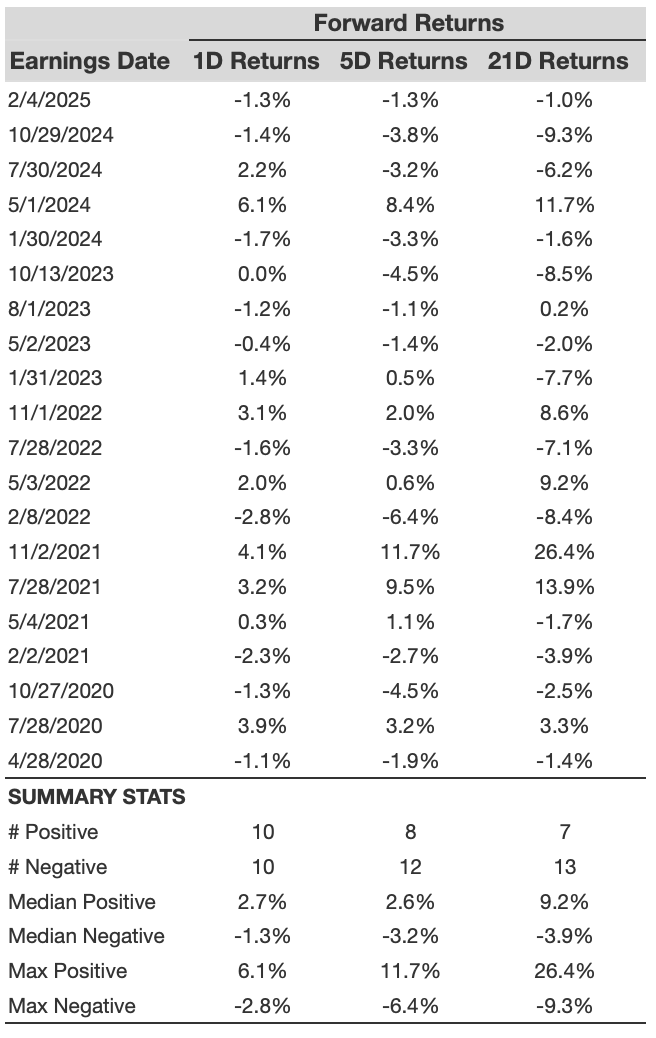
PFE 1D, 5D, and 21D post earnings return
A relatively less risky strategy (though not useful if the correlation is low) is to understand the correlation between short-term and medium-term returns post earnings, find a pair that has the highest correlation, and execute the appropriate trade. For example, if 1D and 5D show the highest correlation, a trader can position themselves “long” for the next 5 days if 1D post-earnings return is positive. Here is some correlation data based on 5-year and 3-year (more recent) history. Note that the correlation 1D_5D refers to the correlation between 1D post-earnings returns and subsequent 5D returns.
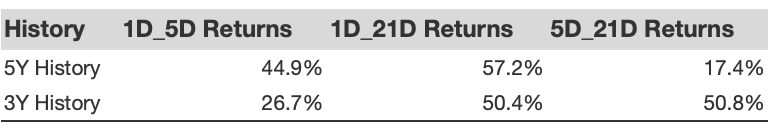
PFE Correlation Between 1D, 5D and 21D Historical Returns
Sometimes, peer performance can have influence on post-earnings stock reaction. In fact, the pricing-in might begin before the earnings are announced. Here is some historical data on the past post-earnings performance of Pfizer stock compared with the stock performance of peers that reported earnings just before Pfizer. For fair comparison, peer stock returns also represent post-earnings one-day (1D) returns.

PFE Correlation With Peer Earnings
Learn more about Trefis RV strategy that has outperformed its all-cap stocks benchmark (combination of all 3, the S&P 500, S&P mid-cap, and Russell 2000), to produce strong returns for investors. Separately, if you want upside with a smoother ride than an individual stock like Pfizer, consider the High Quality portfolio, which has outperformed the S&P, and clocked >91% returns since inception.
Invest with Trefis Market-Beating Portfolios
See all Trefis Price Estimates
The views and opinions expressed herein are the views and opinions of the author and do not necessarily reflect those of Nasdaq, Inc.
© 2025 Lime Trading (CY) Ltd
Lime Trading (CY) Ltd is authorised and regulated by the Cyprus Securities and Exchange Commission in accordance with license No.281/15 issued on 25/09/2015. The "Just2Trade" trademark is owned by LimeTrading (CY) Ltd.
Registration Number: HE 341520
Address: Lime Trading (CY) Ltd
Magnum Business Center, Office 4B, Spyrou Kyprianou Avenue 78
Limassol 3076, Cyprus
Disclaimer:
All promotions, materials and information of this website may have applied conditions. Please contact the Company for further details
Trading on financial markets carries risks. The value of the investments can both increase and decrease and the investors may lose all their investment capital. In case of a leveraged product, the loss may be more than the initial capital invested. Detailed information on risks associated with trading on financial markets can be found in General Terms and Conditions for the Provision of Investment Services.
E-mail: 24_support@j2t.com